How to analyze survey results effectively
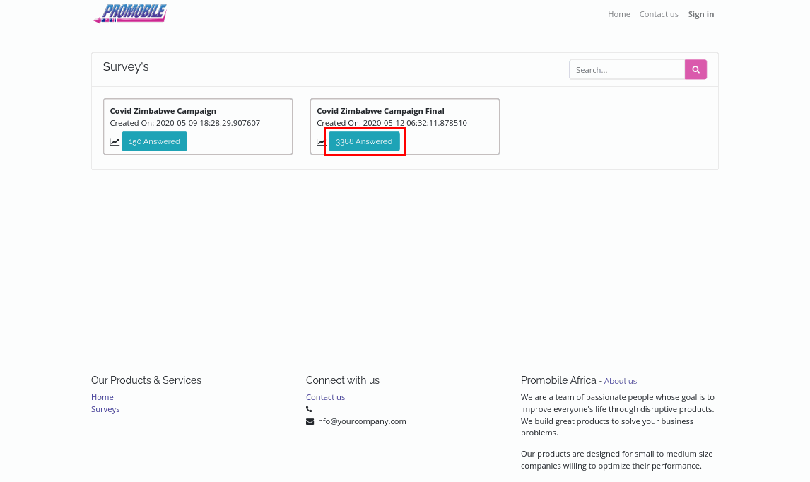
Step 1: Open the survey listing page
Click here to open a list of completed and ongoing surveys.
Step 2: Choose the survey you are interested in
On the survey listing page, choose the survey you are interested in and click on the
Answered
button.
Step 3: Analyzing the results
By default, the survey results page shows data based on all collected answers and metrics. To display results based on responses collected for specific questions, the survey results page offers two options:
1. Question filter - These filters are useful when you want to filter the results based on whether the participant has answered a specific question. For example, to see only results where participants have answered question A.
2. Option filter - These filters are useful when you want to filter the results based on whether the participant has selected a specific answer to a question. These filters are available for single choice and multiple choice type of questions.
Step 3: Analyzing the results
By default, the survey results page shows data based on all collected answers and metrics. To display results based on responses collected for specific questions, the survey results page offers two options:
1. Question filter - These filters are useful when you want to filter the results based on whether the participant has answered a specific question. For example, to see only results where participants have answered question A.
2. Answer filter - These filters are useful when you want to filter the results based on whether the participant has selected a specific answer to a question. These filters are available for single choice and multiple choice type of questions.
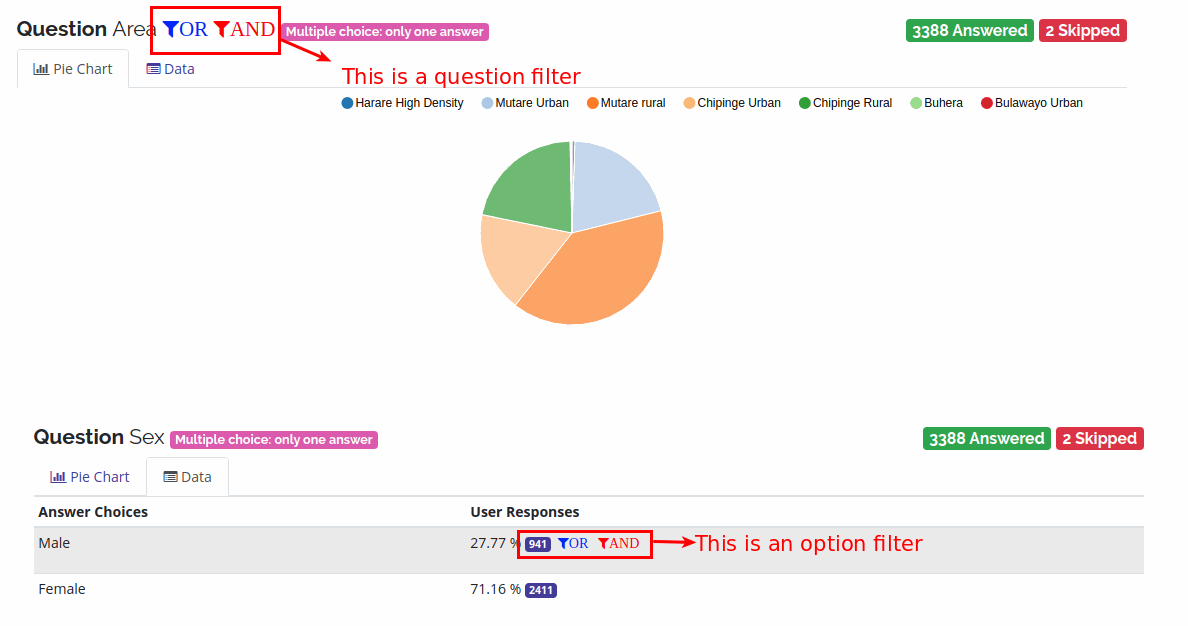
Step 4: Using question filters
To use a question filter, simply hover on the specific question you would like to filter and click on either the OR or AND filter icons, depending on the case. Once you have clicked on the filter icon, you may repeat the process for other questions you need to filter.
Step 5: Using answer filters
To use an answer filter, click on the Data tab of the question, and against the answer you would like to filter, click on either the OR or AND filter icons, depending on the case. Once you have clicked on the filter icon, you may repeat the process for other answers you need to filter.
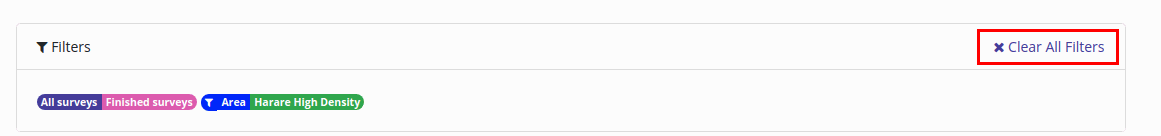
Step 6: Clearing filters
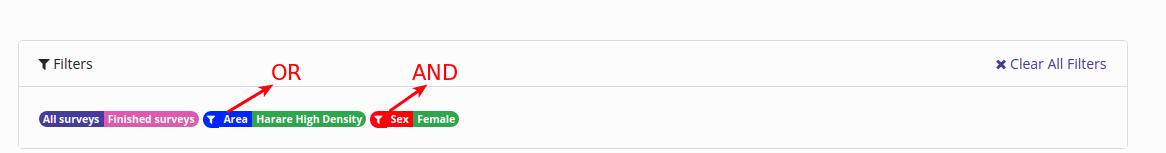
Each filter that you apply will be shown in the filters box at the top of the page.
Filters that have been applied using the OR filter are indicated by a Blue background and a RED background indicates an AND filter.
To clear the filters, simply click on the Clear All Filters link in the filter box.
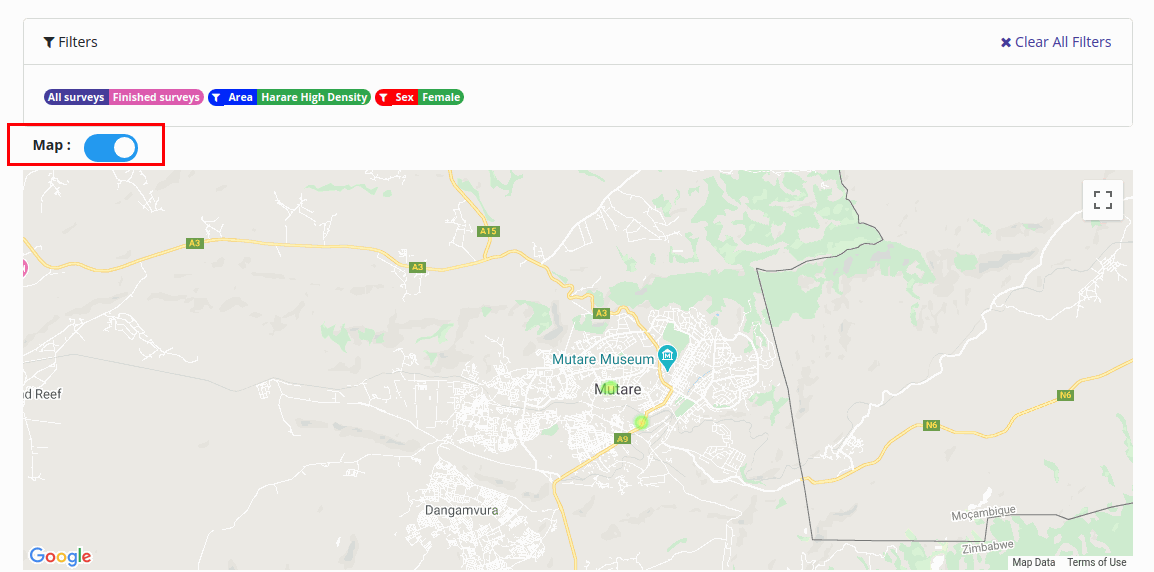
Step 7: Visualizing data using heat maps
The survey results page also offers a way to plot the results as a heatmap layer on top of google maps. To switch to the heat map view, simply turn on the Map switch.
The heat map uses the locations the answers were collected from and also works well with filters. For example, in the screenshot below, the heatmap shows all responses where Area = Harare High Density AND Sex = Female.